 Follow
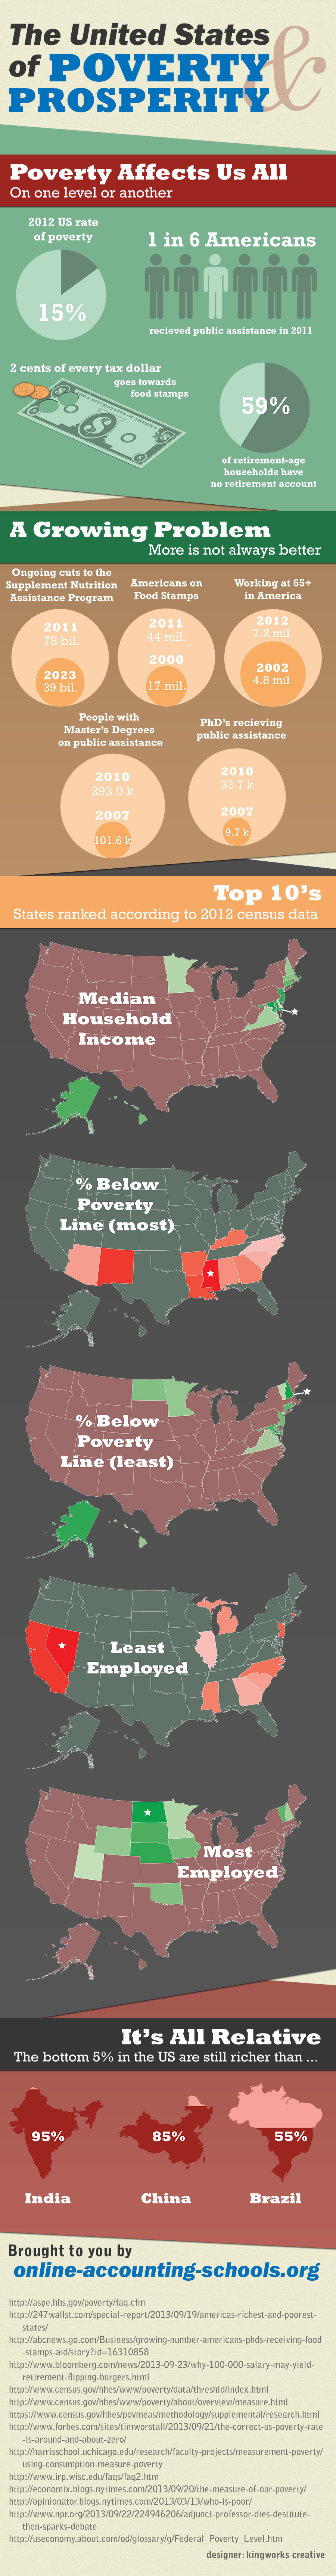
According to an opinion piece in the N.Y. Times in March 2013, there are three ways to define poverty in the USA: (1) The Census bureau method based on family size and income thresholds; (2) the Supplementary Poverty Measure; and (3) a consumption-based method based on household spending.
In comparison, an opinion piece in Forbes in September 2013 claims that the poverty rate in the U.S. is “around zero”. The piece says that “poverty” used to be measured based on the “number of people who were poor after” assistance, whereas it’s now measured on the “number of people who are poor before” assistance. (With “poor” being defined as having to spend more than 1/3 income on a “minimally accepted diet”, according to yet another N.Y. Times opinion piece.) In many other developed countries, being poor is defined as being someone earning “less than half the income of a typical citizen in the middle of the income distribution.”
In other words, many other countries define poverty as a relative measure instead of some hard standard. E.g., being below 60% of median income is being in poverty, and being below 50% is absolute poverty. The Forbes piece further concludes that, based on a relative measure of poverty, the bottom 5% of the poor in the U.S. are “richer than 95% of all Indians, 85% of all Chinese, and 55% of all Brazilians.”
U.S. Poverty and Prosperity: The Numbers
The Harris School of Public Policy at the University of Chicago says on their website that “a consumption-based measure of poverty would do a better job of capturing the extent of, and changes over time in deprivation in the U.S.” for a variety of reasons including: long-term prospects, the effects of saving and dissaving, access to credit, material hardship, private and government transfers, under-reported income.
It’s true that the current Census Bureau definition does not factor in needs after assistance, nor transient poverty, where a person or family recovers the following year. The Bureau’s poverty thresholds are the same regardless of you where you live. Nevertheless, the U.S. has a demographic dichotomy of prosperity and poverty — often in the same state. While having a higher college/ university degree typically translates into higher salaries, that’s not always the case, as evidence by “Ph.D.s on food stamps” data. On the flipside, there are an increasing number of millionaires in the world, and the USA keeps generating more new millionaires than any other country.
Here are some general statistics followed by state breakdowns.
- $23,550 /year is the annual income level for a family of four (children under 18) at which the Federal poverty guideline is defined for 2013. Subsidies are given both below that level as well as up to certain earning thresholds above that level, under various eligibility criteria.
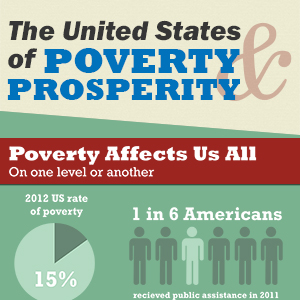
- 15% was the U.S. national poverty rate for 2012 — roughly same as 2011, but higher than for 2007, before the economic crisis.
- Roughly 1 in 6 Americans received food stamps or public assistance in 2011.
- 17M people were on food stamps in 2000.
- 44M people were on monthly food stamps in 2011, according to the U.S. Dept of Agriculture — a 158.82% increase over 11 years, or a year-over-year average change of 14.4%.
- 9,776 people with Ph.D.s (non-tenured) received some public assistance in 2007.
- 33,655 people with Ph.D.s receive public assistance in 2010 — a 244.26% increase over the three-year period, more than doubling each year.
- 22M Americans had Master’s degrees or higher in 2010.
- 101.6K (101,682) Americans with Master’s degrees received some form of assistance in 2007.
- 360K (293,029) Americans with Master’s degrees received assistance in 2010 — an increase of 188.18% over the three-year period.
- $82,556 is the average salary for U.S. professors, according to the American Association of University Professors’ report.
- $20-25K is the average pay range for part-time (non-tenure track) college professors.
- 75% of college instructors fall into the non-tenured category.
- $1 of every $50 federal dollars goes towards food stamps.
- $78B is the cost of the SNAP (aka food stamps) program in 2011.
- $39B is the amount voted on in government in late 2013 to be cut from SNAP over 10 years.
- ~7.2M Americans 65 years and older were working in 2012.
- That’s a 67% increase from a decade prior.
- 59% of households headed by people 65 or older have no retirement account.
- 8,000 per day is the approximate number of Baby Boomers turning 65 — and instead of fully retiring, some of them are competing for part-time minimum wage jobs. This generation is the first actually expected to fund their own retirements by working to supplement any pensions.
10 Poorest U.S. States
The rankings below are based on U.S. Census 2012 figures for “percentage below the poverty line”.
- Mississippi — 24.2%
- New Mexico — 20.8%
- Louisiana — 19.9%
- Arkansas — 19.8%
- Kentucky — 19.4%
- Georgia — 19.2%
- Alabama — 19%
- Arizona — 18.7%
- South Carolina — 18.3%
- North Carolina — 18%
10 Least Poor U.S. States
The rankings below are once again based on the Census 2012 figures for “percentage below the poverty line” — not on median income (see below).
- New Hampshire — 10%
- Alaska — 10.1%
- Maryland — 10.3%
- Connecticut — 10.7%
- New Jersey — 10.8%
- North Dakota — 11.2%
- Minnesota — 11.4%
- Hawaii — 11.6%
- Virginia — 11.7%
- Vermont — 11.8%
10 Richest U.S. States
The rankings below are based on the Census 2012 figures for “median household income” — not necessarily on buying power or cost of living.
- Maryland — $71,122
- New Jersey — 69,667
- Alaska — $67,712
- Connecticut — $67,276
- Hawaii — $66,259
- Massachusetts — $65,339
- New Hampshire — $63,280
- Virginia — $61,741
- Minnesota — $58,906
- Delaware — $58,415
10 Least Employed U.S. States
The rankings below are based on the Census 2012 for unemployment rate — which does not include people who are employed part-time or have officially stopped searching.
- Nevada — 11.1%
- California — 10.5%
- Rhode Island — 10.4%
- New Jersey — 9.5%
- North Carolina — 9.5%
- Mississippi — 9.2%
- Michigan — 9.1%
- South Carolina — 9.1%
- Georgia — 9%
- Illinois — 8.9%
10 Most Employed U.S. States
The rankings below are based on the Census 2012 figures for unemployment rate — which does not include people who are employed part-time or have officially stopped searching.
- North Dakota — 3.1%
- Nebraska — 3.9%
- South Dakota — 4.4%
- Vermont — 5%
- Iowa — 5.2%
- Oklahoma — 5.2%
- Wyoming — 5.4%
- New Hampshire — 5.5%
- Minnesota — 5.6%
- Utah — 5.7%
5 Tips to Stretch Your Income
Based on existing poverty definitions, being able to eat is a significant factor in determining poverty level. While the following tips may not solve all financial problems, many of these are overlooked and can save a few thousand dollars yearly.
- Set up a garden. If you don’t have a yard, look into community gardens. In some areas they are low-cost or even free to setup — beyond the cost of your tools and time. Get family members and friends to help.
- Grow herbs in pots. Most fresh herbs are expensive and don’t last very long. Grow your own in tiny pots at home, on a windowsill or in the kitchen.
- Check farmers’ markets. Many markets reduce their prices towards the end of their operating time. If you don’t mind a few wilted vegetables, you can get some deals. Ask about properly refrigerated meats as well. If you have a smartphone, install a “farmers market” app to search for a market near you.
- Buy in bulk but only if you can find some friends to share with you. Buying huge cans of various foods isn’t always the best deal because sometimes the food spoils before you can finish it. Better to get more of a smaller size and split the savings with someone else.
- Plan your shopping. Not putting a list together means you’re more likely to randomly pick up stuff from a supermarket — whether you need it or not. Just because it’s on sale means nothing if you end up throwing it out. Coupons of course can reduce costs, as can sales, loyalty rewards cards, overstocks and more. Spend at least 15 minutes towards each shopping trip to plan meals and then buy just what you need.
References:
Information for this article was collected from the following pages and web sites:
- http://aspe.hhs.gov/poverty/faq.cfm
- http://247wallst.com/special-report/2013/09/19/americas-richest-and-poorest-states/
- http://abcnews.go.com/Business/growing-number-americans-phds-receiving-food-stamps-aid/story?id=16310858
- http://www.bloomberg.com/news/2013-09-23/why-100-000-salary-may-yield-retirement-flipping-burgers.html
- http://www.census.gov/hhes/www/poverty/data/threshld/index.html
- http://www.census.gov/hhes/www/poverty/about/overview/measure.html
- https://www.census.gov/hhes/povmeas/methodology/supplemental/research.html
- http://www.forbes.com/sites/timworstall/2013/09/21/the-correct-us-poverty-rate-is-around-and-about-zero/
- http://harrisschool.uchicago.edu/research/faculty-projects/measurement-poverty/using-consumption-measure-poverty
- http://www.irp.wisc.edu/faqs/faq2.htm
- http://economix.blogs.nytimes.com/2013/09/20/the-measure-of-our-poverty/
- http://opinionator.blogs.nytimes.com/2013/03/13/who-is-poor/
- http://www.npr.org/2013/09/22/224946206/adjunct-professor-dies-destitute-then-sparks-debate
- http://useconomy.about.com/od/glossary/g/Federal_Poverty_Level.htm